Everything above shows your tracks placed in 2D using precomputed embeddings. Pick a listener
to animate their plays, recolor points by any song attribute, and click points for details as
you go.
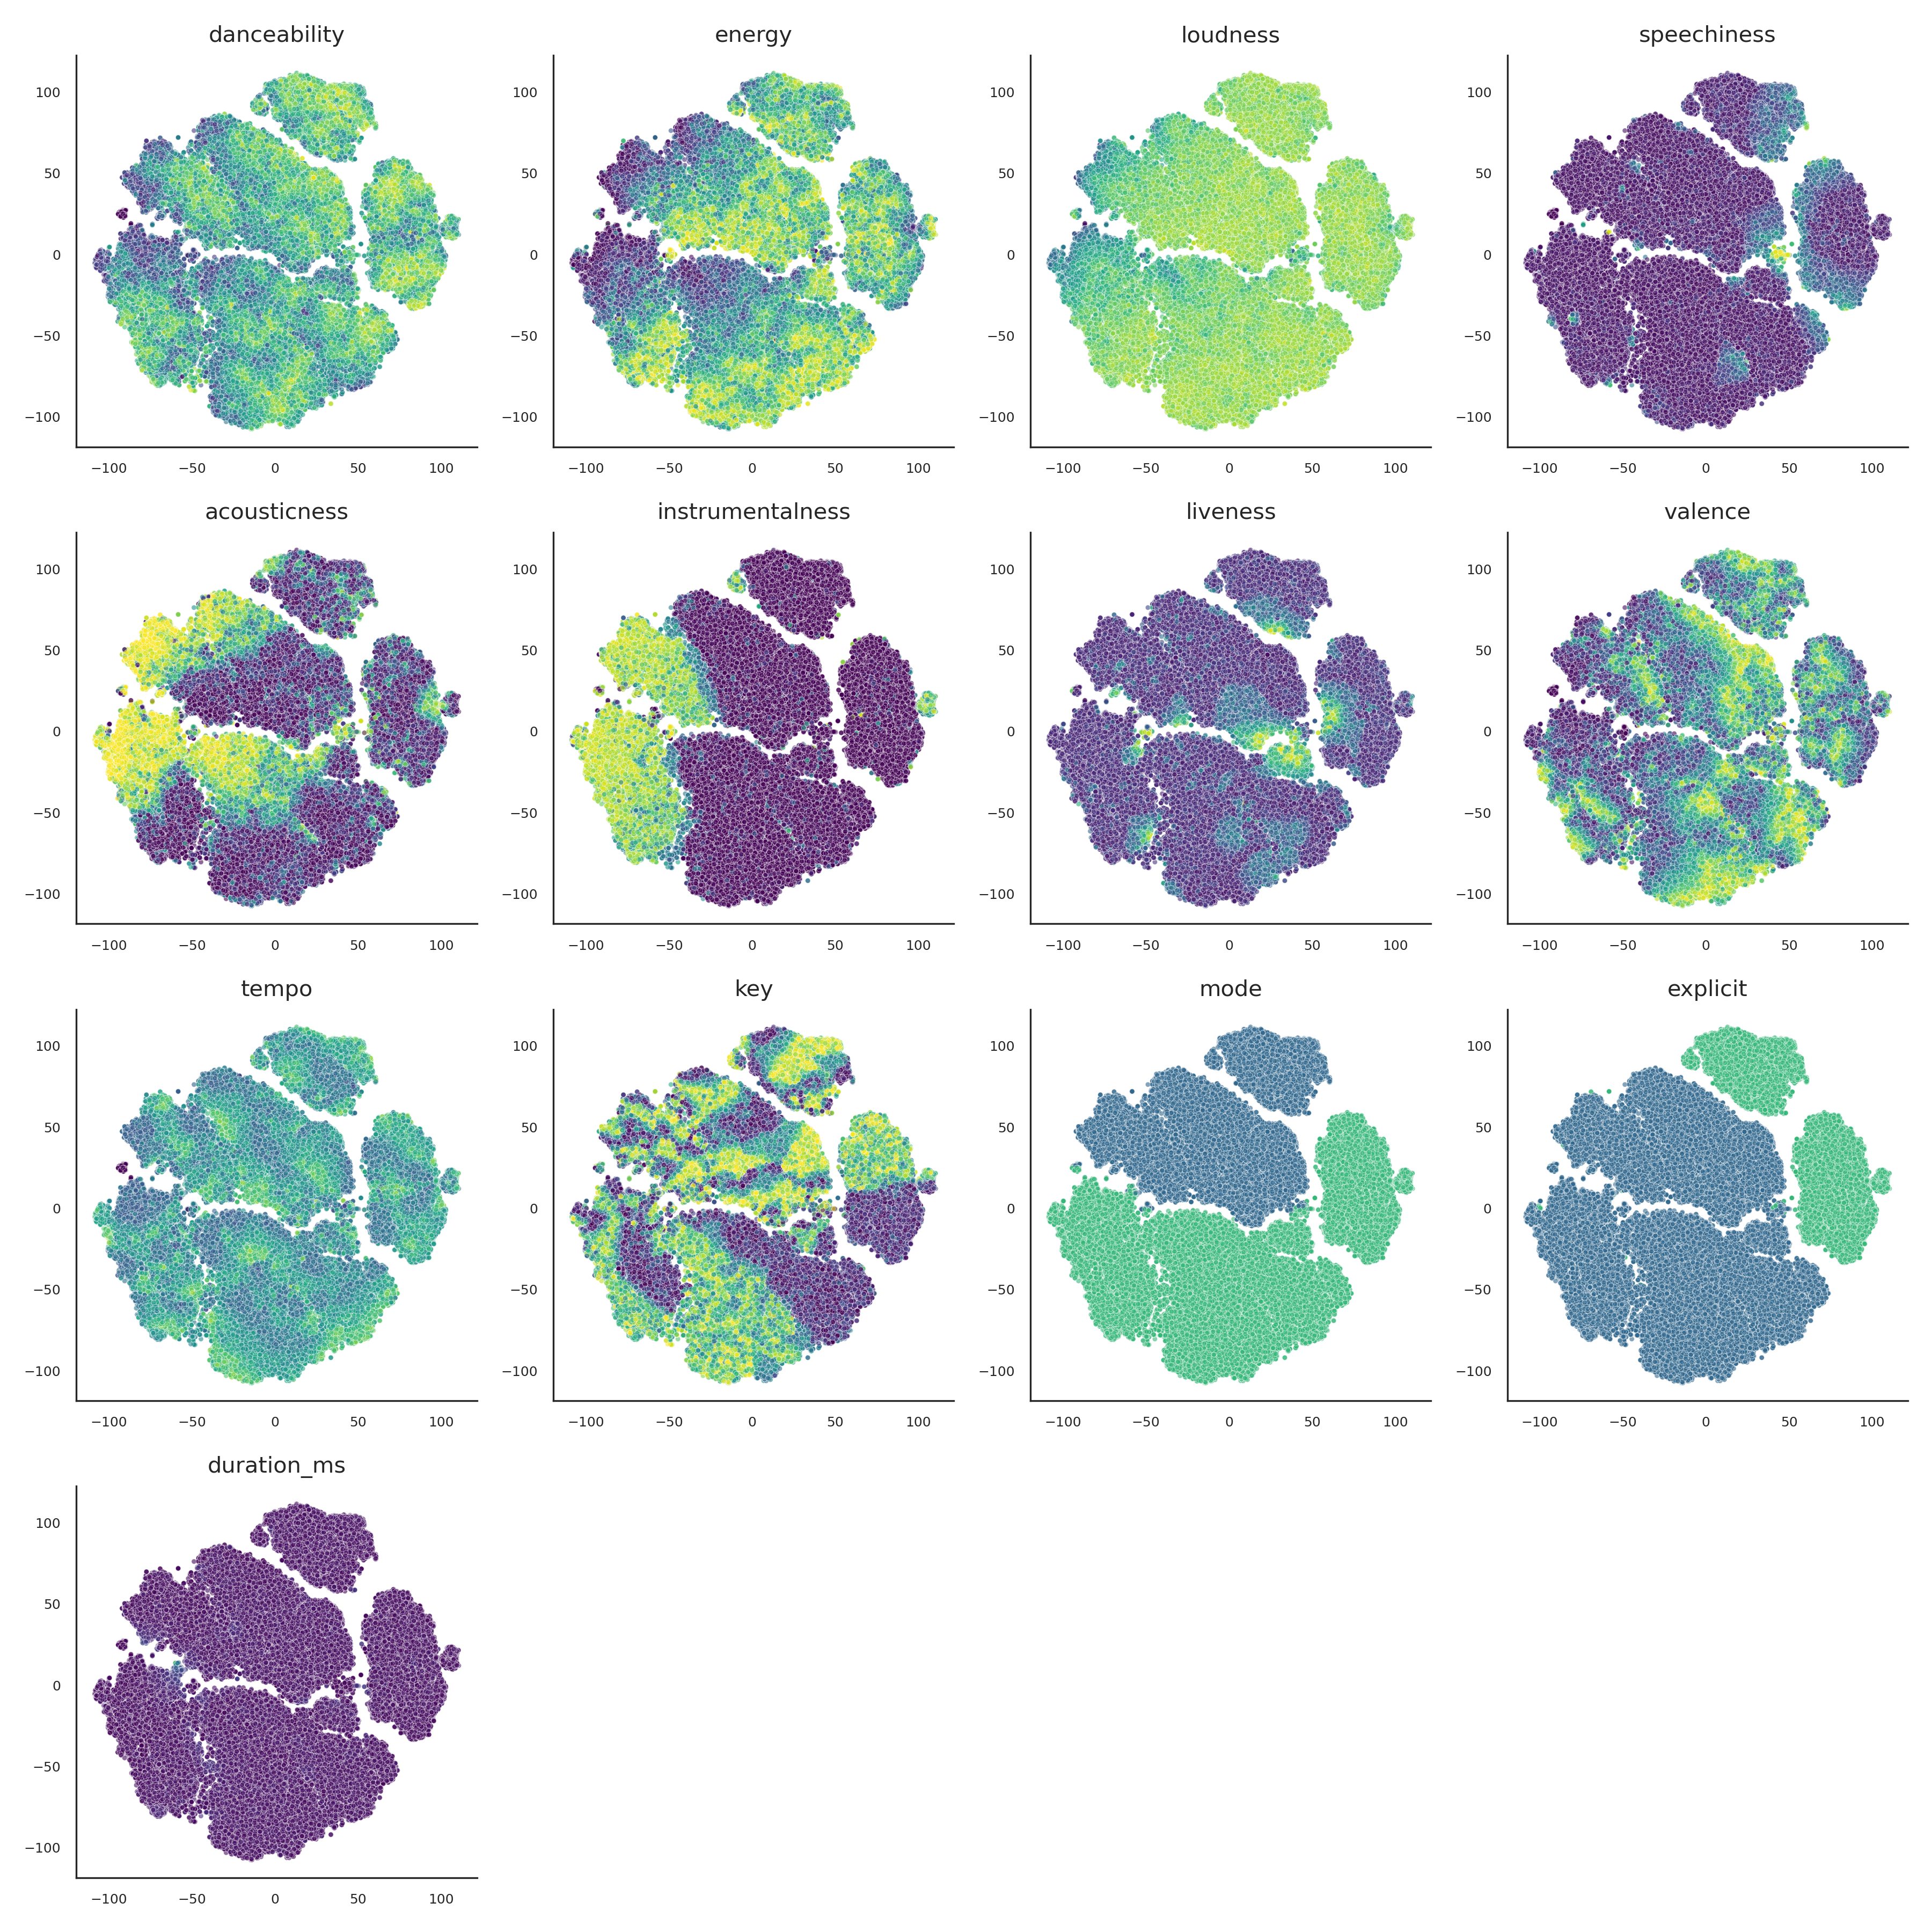
Each song in your dataset has many attributes (danceability, energy, tempo, etc.). Projections
such as PCA, UMAP, or t-SNE compress all those attributes into just two axes so we can see the
entire catalog at once. PCA stands for Principal Component Analysis, t-SNE is t-distributed
Stochastic Neighbor Embedding, and UMAP is Uniform Manifold Approximation and Projection. Each
prioritizes different structure, letting you compare how the same songs organize under multiple
views.
Want a deeper dive? This
short presentation
walks through the projections step by step, including how the embeddings were produced and what
to look for when interpreting them.
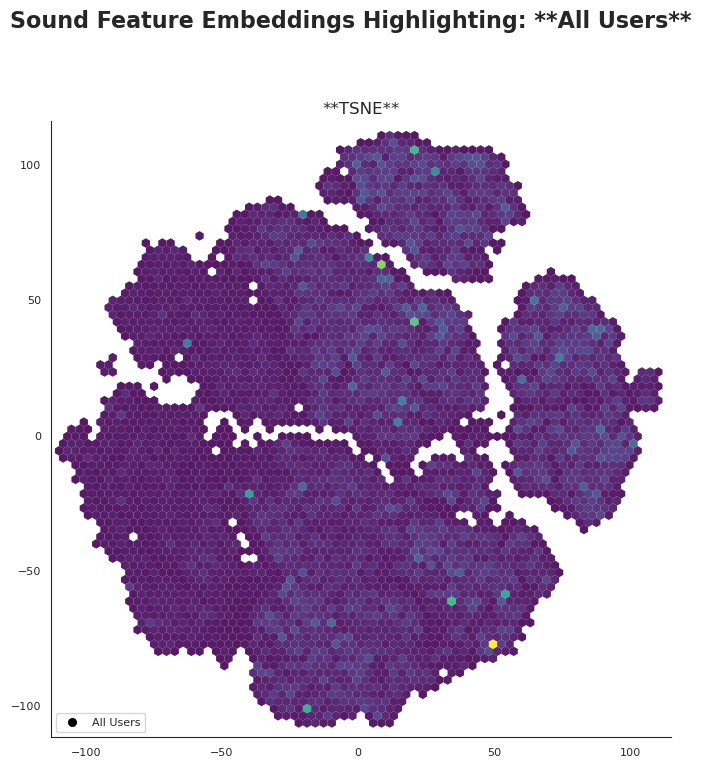
How to read the explorer
Each dot is a track. Colors come from the attribute you choose on the right, and the path
shows the selected listener's session over time.
Pick a listener to animate their journey, then scrub the slider or hit
play in the transport bar.
Try different colorings to surface danceability, energy, acousticness,
speechiness, instrumentalness, loudness, liveness, tempo, key/mode, explicit flag, and
duration patterns.
Swap embeddings to compare how UMAP, t-SNE, and PCA arrange the same
library.
See how this listener's songs cluster in the embedding — essentially their taste profile across
the selected projection.
Embedding quick tour
Click a card to see how each projection distributes the same tracks.
Need to update the data?
Replace songs.csv and drop new listener histories into the
histories/ folder, then refresh.